Weather homeschool curriculum: meteorology unit study for K-12
By Hands Down Education · Published · Updated
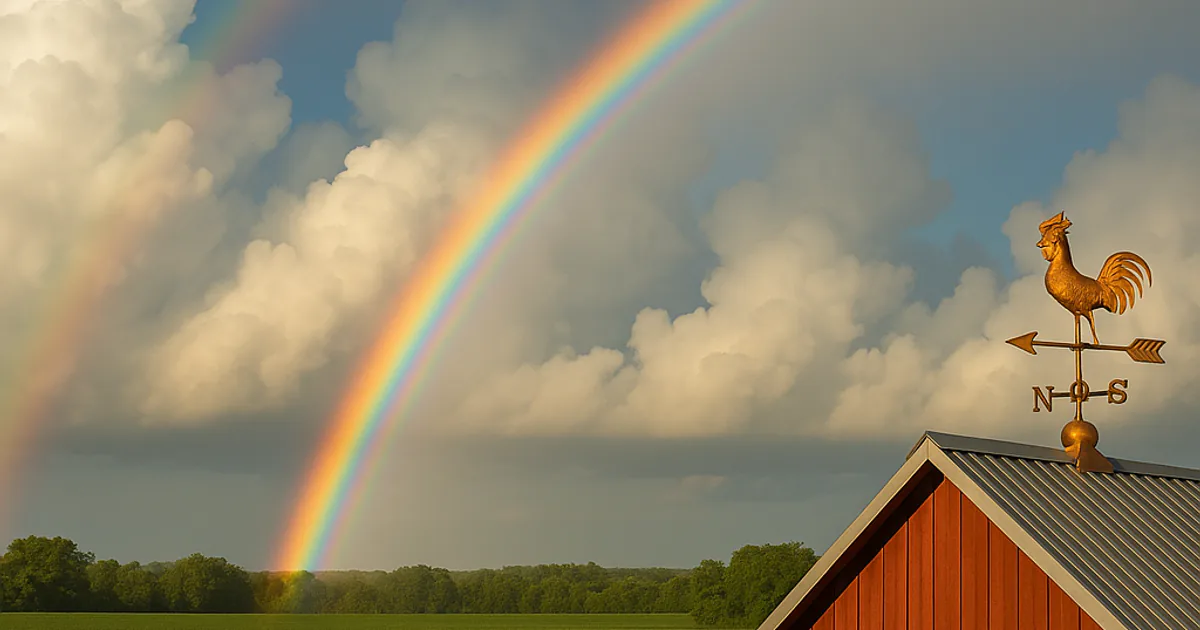
Weather is the rare science that delivers new data every single day, for free, outside the window. A weather-centered curriculum teaches genuine scientific method — observe, record, predict, check — on a loop that never runs out of material.
Children drawn to storms are often drawn to scale and power; the curriculum channels that into instrumentation, atmospheric physics, and the statistics of forecasting, where being right 70% of the time is a professional achievement rather than a failure.
Build a weather & storms unit for your child
Generate a complete, standards-aligned curriculum around this interest in minutes — free to try, no account required.
What your child will learn
By the end of this unit a child working at their own grade band can:
- Chart the daily weather with symbols for a month and describe the patterns — what usually follows a gray morning, which direction the wind comes from before rain. (Science · Earth Science, K-ESS2)
- Record the daily high and low for a week and show them on a line plot, then say which day had the biggest swing. (Math · Data and Geometry, 2.MD.D)
- Map where hurricanes, monsoons and tornado alleys occur and explain what geography puts each hazard where it is. (Science · Earth Science, 3-ESS2)
- Describe how communities in hurricane, flood and tornado regions build and prepare differently, and evaluate one of those solutions against its cost. (Science · Earth and Human Activity, 4-ESS3)
- Read a homemade barometer against the coming weather and explain the result in terms of air masses, fronts and pressure. (Science · Earth Science, MS-ESS2)
- Calculate the mean and range of a week of temperatures and rainfall from your own log and describe the distribution in a sentence. (Math · Statistics, 6.SP.A)
- Compare a month of forecasts with what actually happened and express the forecaster's accuracy as a probability, explaining why 70 percent is a professional result. (Math · Probability, 7.SP.C)
- Write a forecast bulletin for a historic storm as it would have been issued the day before, with the uncertainty stated honestly and the evidence grouped clearly. (Language Arts · Writing, W.4.2)
A sample week
Reading & Writing
Read a first-hand account of a historic storm, then write a forecast bulletin for it as it would have been issued the day before — with the uncertainty stated honestly.
Math
Record daily high, low and rainfall for a week, then graph it and calculate the mean and range — real data your child generated.
Science
Build a barometer from a jar and balloon, log its readings against incoming weather, and test whether falling pressure really predicts rain.
Social Studies
Map where hurricanes, monsoons and tornado alleys occur and explain what geography puts them there — and how those places build differently as a result.
Art
Study cloud types by sketching the actual sky for five days, labeling each formation like a naturalist would.
Get the 6-week planner + new unit ideas
A print-ready PDF of this weather & storms unit study — the six-week scope and sequence, grade-band notes, reading list and FAQs — plus an occasional email when a new interest guide goes up.
Adapting by grade
K-2 learners chart daily weather with symbols, learn cloud names, and connect clothing choices to observation — early data literacy disguised as getting dressed.
Older students can work with live radar and model data, study climate versus weather rigorously, and analyze forecast accuracy statistically — an excellent introduction to probability.
Homeschool curriculum guides by grade band: Early Learners (K–2) · Elementary (3–5) · Middle School (6–8) · High School (9–12)
Activities by grade band
Grades K-2: the daily chart, cloud names and dressing for the sky
Young children can be weather observers from the first day: a symbol for each day's sky on the fridge chart, a thermometer read together, a rain jar checked after a storm, and the clothes chosen from the observation rather than the calendar. A K-2 weather unit is looking out the window on purpose, every day, and the chart at the end of a month is real data the child made.
- Sky symbols: every morning at the same time, draw the sky in that day's box — sun, cloud, rain, snow, wind — and at the end of the month count how many of each. How-to: the box is drawn before breakfast; the count is done together with tally marks.
- Rain jar: put a straight-sided jar outside in the open, mark the water level with a piece of tape after each rain, and pour it out; compare the tape marks at the end of the week. How-to: a ruler beside the jar shows which rain was biggest.
- Cloud match: print the three main cloud shapes — puffy cumulus, flat stratus, wispy cirrus — and each day hold the sheet up to the sky and say which one is there. How-to: keep the sheet on the window sill; add the day's match to the chart.
Reading suggestion: The Cloud Book by Tomie dePaola, a picture-book tour of the cloud types and the sayings about them, and Weather Words and What They Mean by Gail Gibbons for the vocabulary the chart uses.
Early Learners homeschool curriculum guide (grades K–2)
Grades 3-5: instruments, graphs and the first forecast
Upper elementary students can build the instruments, keep the numbers and make a forecast that gets checked: a jar-and-balloon barometer, a week of highs and lows on a line plot, a hazard map that explains why hurricanes and tornadoes live where they do. Being wrong about tomorrow in public, and finding out why, is the unit's real lesson in how science works.
- Balloon barometer: stretch a cut balloon over a jar, tape a straw to it as a pointer, mark where it points on a card each morning, and log whether the next day brought rain. How-to: keep the jar indoors away from the window so temperature does not fool it.
- Line plot week: record the daily high and low from the porch thermometer for seven days, draw both as lines on one graph, and say which day had the biggest swing and why that might be. How-to: graph paper, days along the bottom, degrees up the side, two colors.
- Hazard map: on a printed world map, shade where hurricanes form, where monsoons fall and where tornado alley lies, and write a sentence for each on what the geography there has to do with it. How-to: the National Weather Service JetStream pages for the why.
Reading suggestion: The Kid's Book of Weather Forecasting by Mark Breen and Kathleen Friestad, which builds the home weather station and teaches how to read it, and National Geographic Kids Everything Weather by Kathy Furgang.
Elementary homeschool curriculum guide (grades 3–5)
Grades 6-8: air masses, fronts, statistics and forecast accuracy
Middle schoolers can explain the readings — pressure, fronts and air masses — calculate the mean and range of their own month of data, and score the official forecast against what actually happened as a probability. The unit becomes earth science and statistics with a long, honest data record, and the writing turns to a bulletin with the uncertainty stated.
- Front tracker: for two weeks, note the pressure trend, wind direction and temperature each morning, then match the days when all three shifted against the fronts drawn on the National Weather Service surface map. How-to: print the day's surface map and staple it to the log entry.
- Mean and range: from a month of your own highs, lows and rainfall, calculate the mean and range of each and write one sentence per number saying what it describes about the month. How-to: a spreadsheet or a long-hand table with the sum, the count and the division shown.
- Forecast scorecard: for thirty days, record the official forecast's rain chance and whether it rained, then calculate how often the forecast was right and explain why a forecaster who is right seventy percent of the time is doing well. How-to: one row per day, two columns — forecast, outcome — and the tally at the bottom.
Reading suggestion: The Cloudspotter's Guide by Gavin Pretor-Pinney, which teaches the clouds and the physics behind them with humor, and the JetStream online school at the National Weather Service for fronts and air masses.
Middle School homeschool curriculum guide (grades 6–8)
Grades 9-12: climate versus weather, real data and a written bulletin
High schoolers can work with the real archives: this month against the thirty-year average from NOAA's records, a historic storm reconstructed from newspaper accounts and reissued as an honest bulletin, and a written account of what a forecast model can and cannot know. Six weeks of this with the data kept is a legitimate earth-science and statistics portfolio.
- This month versus normal: download the daily records for your station from NOAA's National Centers for Environmental Information, compare this month's mean temperature and rainfall with the long-term average, and write whether the difference is unusual and how you decided. How-to: one table, one graph, one paragraph on what 'unusual' means statistically.
- The day-before bulletin: read two first-hand accounts of a historic storm from the Library of Congress newspaper archive, then write the forecast bulletin as it should have been issued the day before, with the uncertainty stated in the language forecasters use. How-to: the bulletin quotes no hindsight; every claim must be knowable the day before.
- Model limits essay: read a plain-language explanation of how numerical weather models work, then write two pages on why forecasts lose skill after a few days and what that means for planning a wedding or an evacuation. How-to: two sources cited, one from the National Weather Service.
Reading suggestion: Isaac's Storm by Erik Larson, the account of the 1900 Galveston hurricane and the forecaster who did not see it coming, read beside the bulletin week.
Six-week scope and sequence
| Week | Focus | Key activity | Output |
|---|---|---|---|
| 1 | The log begins | Start the sky-symbol chart and the porch thermometer readings; set out the rain jar; do the cloud match each morning. Skill from the list above: chart the daily weather with symbols and describe the patterns (K-ESS2). | The first week of the chart with symbols, temperatures and rain marks. |
| 2 | Instruments | Build the balloon barometer and start reading it; older students begin the front tracker with the printed surface map. Skill: read a homemade barometer against the coming weather and explain it in terms of air masses, fronts and pressure (MS-ESS2). | A working barometer with a week of pointer marks and a log of what the next day brought. |
| 3 | The numbers | Draw the line plot of the week's highs and lows; calculate the mean and range; sketch the sky for five days for the art strand. Skill: calculate the mean and range of a week of temperatures and rainfall from your own log (6.SP.A). | A two-line graph, the mean and range with the work shown and five dated cloud sketches. |
| 4 | Where storms live | Shade the hazard map; explain what geography puts each hazard where it is; describe how one community builds differently because of it. Skill: map where hurricanes, monsoons and tornado alleys occur and explain what geography puts each one there (3-ESS2). | A shaded map with a sentence per hazard and a paragraph on one community's preparation. |
| 5 | How good is a forecast | Start the thirty-day forecast scorecard; teens compare this month with the thirty-year normal from NOAA records. Skill: compare a month of forecasts with what happened and express the accuracy as a probability (7.SP.C). | A scorecard with the running accuracy and, for older students, a this-month-versus-normal graph. |
| 6 | The storm and the bulletin | Read a first-hand account of a historic storm; write the day-before bulletin with the uncertainty stated; present the month's data to the family. Skill: write a forecast bulletin for a historic storm as it would have been issued the day before (W.4.2). | A finished bulletin and a one-page summary of the month's weather from the family's own data. |
Materials and free resources
- An outdoor thermometer, a straight-sided jar marked in centimeters as a rain gauge, and a chart on the fridge with a symbol for each day's sky.
- A jar, a balloon, a straw and tape for the barometer; a sketchbook for the five days of cloud drawings; graph paper for the week's line plot.
- National Weather Service (weather.gov): free local forecasts, radar and the JetStream online weather school (weather.gov/jetstream) for the how-it-works reading.
- CoCoRaHS (cocorahs.org): the volunteer rain, hail and snow network that accepts a family's daily gauge readings into a real dataset.
- NASA Climate Kids (climatekids.nasa.gov) and NOAA SciJinks (scijinks.gov): free explainers on weather, climate, clouds and storms for elementary and middle grades.
- The GLOBE Program (globe.gov): a NASA-sponsored citizen-science project with a free cloud-observation app that matches your sky to satellite passes.
- NOAA National Centers for Environmental Information (ncei.noaa.gov): free historical climate records for comparing this month with the long-term average.
- Library of Congress Chronicling America (loc.gov): free historical newspapers with first-hand accounts of past storms for the reading and bulletin week.
Common questions
What equipment do we need?
A thermometer and a rain gauge (or a marked jar) are enough for a full year. Homemade barometers and anemometers are projects in themselves rather than purchases.
How is this different from a science unit we'd do anyway?
Duration and ownership. Weather rewards continuous logging over months, which builds the habit of longitudinal data collection almost nothing else at this age does.
My child is scared of storms — will this help or hurt?
Usually helps considerably. Understanding what causes a storm, and what the actual risks are, tends to convert fear into fascination — but follow your child's pace.
How do I start a weather unit study?
Start the log today. A thermometer on the porch, a jar marked in centimeters for rain and a chart on the fridge with a symbol for each day's sky are the whole first week, and the habit they build is the unit. Add the jar-and-balloon barometer in week two and start checking its readings against the next day's weather, then compare your own numbers with the official forecast for your town. Once a week of data exists, the graph, the mean and the range follow naturally, and the storm reading and the hazard map can be added at whatever pace suits your child.
Is weather a good homeschool subject?
It is one of the best for teaching how science actually works, because it delivers fresh data every day and lets a child predict, check and be wrong in public without cost. The daily log is data literacy; the barometer and cloud sketches are observation and instrumentation; the hazard map is geography; the forecast bulletin is writing with stated uncertainty; and forecast accuracy is a first honest lesson in probability. The skills list above names what a unit teaches and which strand of the standards each skill lands on. Run it for a season rather than a week: the longitudinal record is the point.
Related curriculum ideas
 Volcanoes & Geology homeschool curriculum
A homeschool curriculum built around volcanoes and geology — plate tectonics, rocks, deep time and natural hazards, for K-12 learners.
- Rocks & Minerals homeschool curriculum
A K-12 rocks and minerals homeschool curriculum: collecting, streak and hardness tests, the rock cycle, crystals, density and resources, in a six-week plan.
 Ocean & Marine Life homeschool curriculum
Build a homeschool curriculum around the ocean — marine biology, oceanography and exploration across reading, math, science and geography.
Ready to build a weather & storms unit for your child?
Generate a complete, standards-aligned curriculum around this interest in minutes — free to try, no account required.